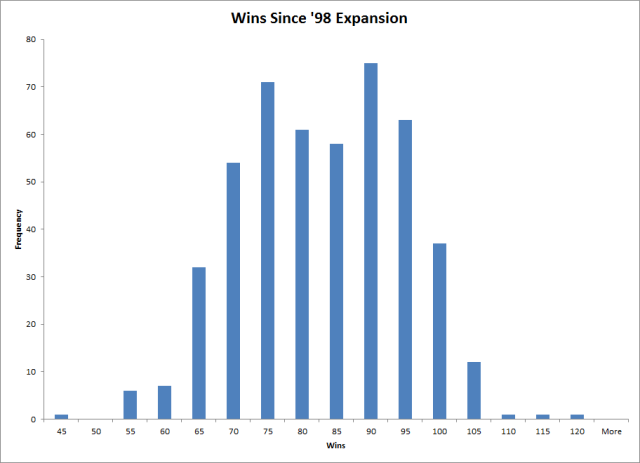
Here, we can see the distribution of win totals since the most recent expansion. Notice that the distribution of wins is essentially bimodal, because teams are incentivized to either perform extremely well and make the playoffs, or extremely poorly to secure a good draft pick. As such, teams have responded to the incentives and created a bit of a “black hole” in the diminished marginal utility patch that is the 75-85 win zone. Also note that each bin label corresponds to the right endpoint of the bin, so teams with 81-85 wins would be in the 85 win bin, and teams with 51-55 in the 55 win bin.
Explaining Terms
-
Recent Posts
Recent Comments
Billy Swift on Finalized 2014 Pitcher Project… Billy Swift on Finalized 2014 Pitcher Project… Brian on Finalized 2014 Pitcher Project… Anirudh Kilambi on Finalized 2014 Pitcher Project… Tal on Finalized 2014 Pitcher Project… Archives
Categories
Meta
